Sniffing out probes part 3
- Friday December 13 2013
- python wifi surveillance
- Series: sniffing-probes
In a previous blog post, I show my first analysis of captured WiFi probes. Since then I have collected more data. Most importantly, the capture script now collects all probes instead of just directed probes. The data analysis is mostly unchanged. The background subtraction has been further tuned. The stations per SSID chart now simply shows the top 10 most popular SSIDs rather than the upper quartile.
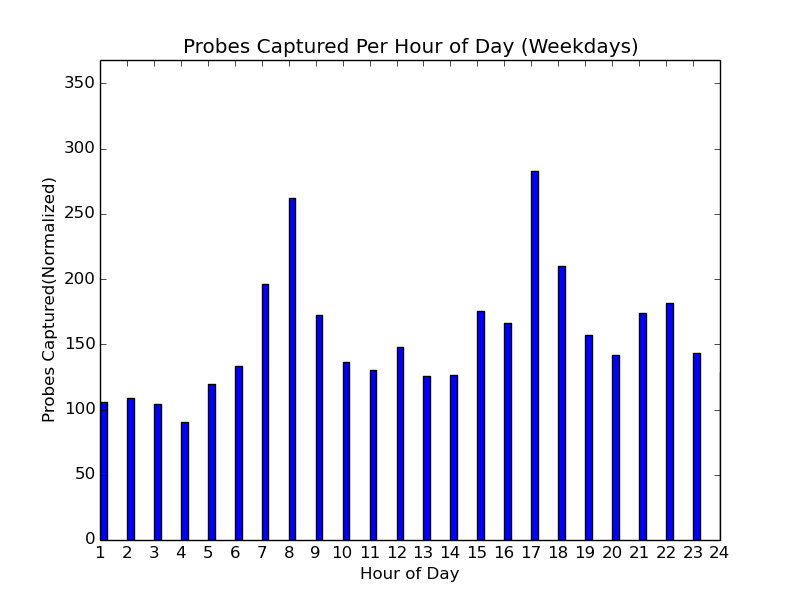
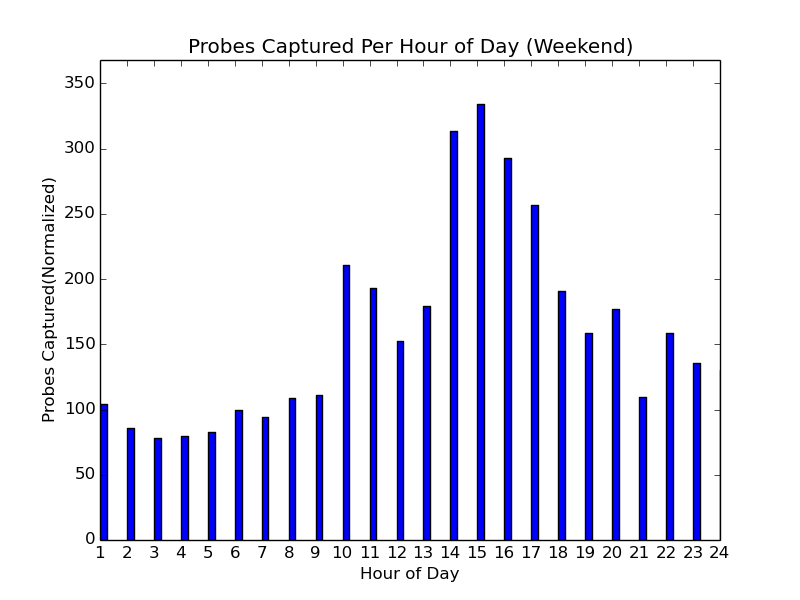
The biggest change this dataset shows from the last is the probes per hour of weekday. There are strong peaks correlating with 8 AM and 5 PM. This agrees with my hypothesis that WiFi activity correlates with traffic patterns.
Graphs
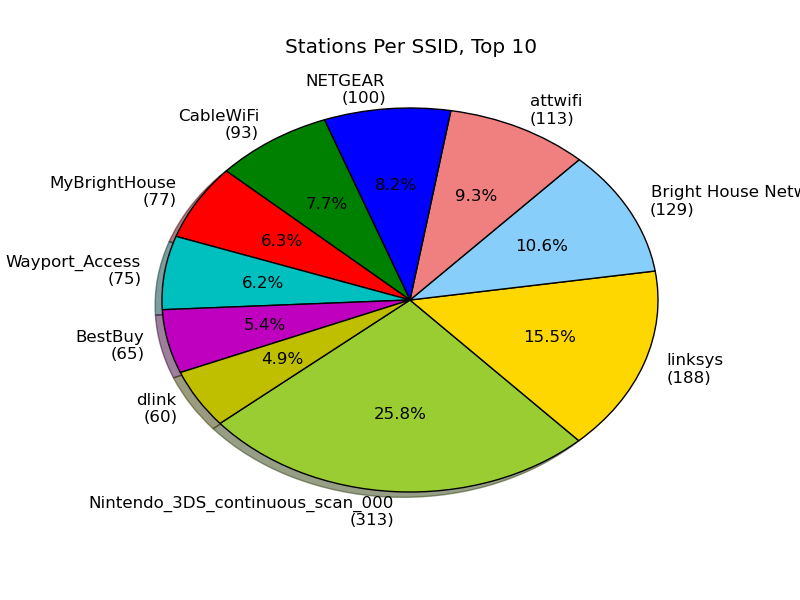
Each SSID is shown along with the number of stations probing for it.
Source code
I have updated the project on GitHub with the latest source code. I used the matplotlib python module to generate the graphs.