Bitten by the SMR bug
- Monday June 22 2020
- linux virtualization
On the evening of Sunday June 21st my home network was working fine. By the morning of June 22nd, things seem to be acting strangely. Local network traffic was working well enough and internet connectivity was present. But sometimes the network seemed to pause for a few seconds and then catch up.
I went through the usual things
- Reset the cable modem
- Check network cabling for signs of damage
- Reset local network hardware like switches
- Temporarily remove my ethernet surge protectors
- Plug my laptop directly into the cable modem to confirm the problem disappeared
So at this point I had not figured anything out. But I was able to rule out most of the network hardware.
My home internet connection goes through a virtual machine I setup using the virsh utility. Both the host & guest are running Ubuntu 18.04 with the Hardware Enablement stack. The virtual machine has multiple ethernet interfaces shared to it from the host. One is connected to the local network, the other one to the cable modem. This lets me do things like use iptables rules to provide NAT between my local network and the internet. I also use the tc utility to setup traffic queueing classes that attempt to provide an equal level of service to all devices on my local network.
I ran a ping from the host machine to the local IP of the VM. This uility just sends a packet to the target machine and requests a reply. This allows lots of simple metrics to be gathered, like the latency. The typical latency on a wired home network is less than 1 millisecond.
$ ping -i 0.22 192.168.12.90
64 bytes from 192.168.12.90: icmp_seq=345 ttl=64 time=0.253 ms
64 bytes from 192.168.12.90: icmp_seq=346 ttl=64 time=0.361 ms
64 bytes from 192.168.12.90: icmp_seq=347 ttl=64 time=0.360 ms
64 bytes from 192.168.12.90: icmp_seq=348 ttl=64 time=1374 ms
64 bytes from 192.168.12.90: icmp_seq=349 ttl=64 time=1151 ms
64 bytes from 192.168.12.90: icmp_seq=350 ttl=64 time=928 ms
64 bytes from 192.168.12.90: icmp_seq=351 ttl=64 time=704 ms
64 bytes from 192.168.12.90: icmp_seq=352 ttl=64 time=480 ms
64 bytes from 192.168.12.90: icmp_seq=353 ttl=64 time=257 ms
64 bytes from 192.168.12.90: icmp_seq=354 ttl=64 time=34.8 ms
64 bytes from 192.168.12.90: icmp_seq=355 ttl=64 time=0.285 ms
64 bytes from 192.168.12.90: icmp_seq=356 ttl=64 time=0.351 ms
64 bytes from 192.168.12.90: icmp_seq=357 ttl=64 time=0.400 ms
64 bytes from 192.168.12.90: icmp_seq=358 ttl=64 time=0.341 ms
From this I could see that some ping requests were answered in the usual time. But some took up to 1.374 seconds to come back. This latency was identical to what I saw when trying to browse the internet. Most page loads were instant, but some seem to be briefly interrupted before returning to normal. The actual bandwidth available was still the typical 100+ Mbps download speeds provided by my ISP.
At this point I was sort of stumped because the pause simply showed up randomly. I ended up running iotop in the virtual machine. This utility shows which processes are performing the most IO operations, like writing to the hard drive. This VM has basically no IO activity. The most common thing writing to the disk is the journald process which is part of systemd. I used the highly advanced troubleshooting techique of having one terminal displaying the ping command and the other one running iotop at the same time. I eventually decided that the IO activity by journald happened at the same time as the "pause". But of course there is no way journald is actually causing a problem with my internet connection or the local network.
To double check my theory I ran dd if=/dev/zero of=./fstest bs=4096 count=25000 in the guest VM. Basically all this does is write a bunch of zeroes into a file. Every time I ran this, the "pause" would happen. I did the opposite and read the file using cat ./fstest > /dev/null, it did not reproduce the problem. So the "pause" seems to happen anytime data is written to the filesystem. It appeared that writing to the disk just caused the VM to temporarily freeze.
Since I'm running a VM, the VM doesn't have a real disk attached to it. The virtual disk is configured in the XML like this
<disk type='block' device='disk'>
  <driver name='qemu' type='raw' cache='none' io='native'/>
  <source dev='/dev/corona/gateway_ii'/>
  <backingStore/>
  <target dev='vda' bus='virtio'/>
  <alias name='virtio-disk0'/>
  <address type='pci' domain='0x0000' bus='0x00' slot='0x09' function='0x0'/>
</disk>
This exposes the host block device /dev/corona/gateway_ii to the virtual machine as a hard drive. However, even /dev/corona/gateway_ii is not a real device. It is built using LVM from multiple physical devices. You can run the lsblk command on the host to see the makeup of those devices. I've trimmed the output of the command down to just those relevant to the device used by my VM
$ lsblk
NAME                               MAJ:MIN RM   SIZE RO TYPE MOUNTPOINT
sda                                  8:0    0   7.3T  0 disk
├─corona-gateway_ii_rmeta_1        253:7    0     4M  0 lvm
│ └─corona-gateway_ii              253:9    0    30G  0 lvm
├─corona-gateway_ii_rimage_1       253:8    0    30G  0 lvm
│ └─corona-gateway_ii              253:9    0    30G  0 lvm
sdb                                  8:16   0   7.3T  0 disk
├─corona-gateway_ii_rmeta_0        253:5    0     4M  0 lvm
│ └─corona-gateway_ii              253:9    0    30G  0 lvm
├─corona-gateway_ii_rimage_0       253:6    0    30G  0 lvm
│ └─corona-gateway_ii              253:9    0    30G  0 lvm
So by looking at the output lsblk we can see that the physical devices sda and sdb are used to actually hold /dev/corona/gateway_ii. The reason why multiple drives are used is because in LVM this is created as a mirror, so there are at least two copies of the data at any point in time.
A failing hard drive could cause a performance issue. This host machine actually has four mehcanical hard drives and one solid state drive. I'm not a stranger to troubleshooting hard drives, so I went through my usual troubleshooting steps
- Ran
smartctl -t short /dev/sdato perform a self-test for each drive. They all passed the test. - Checked
dmesgfor any information about communication problems with a drive. There were none. - Used
dd if=/dev/sda of=/dev/nullto read random sections of the disks. - Powered off the machine, reseated all cables.
All this produced nothing useful. The problem persisted and I still did not know why. Obviously I would need to learn new troubleshooting techniques.
After searching around I found out there is a utility ioping written by Konstantin Khlebnikov. This is similar to the ping utility, but instead of measuring network traffic it just measures how long it takes to read a random 4KB section of a block device.
I started four copies of ioping running on the host machine monitoring /dev/sda, /dev/sdb, /dev/sdc, /dev/sdd respectively. These are my four mechanical drives that are all managed with LVM. I'm not exactly expecting impressive numbers, but reading a random spot on a hard drive usually takes less than 50 milliseconds.
For /dev/sdc & /dev/sdd I saw output like this
$ioping /dev/sdc
4 KiB <<< /dev/sdc (block device 3.64 TiB): request=1 time=24.1 ms (warmup)
4 KiB <<< /dev/sdc (block device 3.64 TiB): request=2 time=12.3 ms
4 KiB <<< /dev/sdc (block device 3.64 TiB): request=3 time=12.0 ms
4 KiB <<< /dev/sdc (block device 3.64 TiB): request=4 time=22.4 ms
4 KiB <<< /dev/sdc (block device 3.64 TiB): request=5 time=18.5 ms
4 KiB <<< /dev/sdc (block device 3.64 TiB): request=6 time=16.5 ms
So a random read takes about 20 milliseconds. That is fast enough to be considered normal by me. Now lets look at the same output for /dev/sda
$ioping /dev/sda
4 KiB <<< /dev/sda (block device 7.28 TiB): request=27 time=262.4 ms
4 KiB <<< /dev/sda (block device 7.28 TiB): request=28 time=1.01 s (slow)
4 KiB <<< /dev/sda (block device 7.28 TiB): request=29 time=63.0 ms (fast)
4 KiB <<< /dev/sda (block device 7.28 TiB): request=30 time=28.8 ms (fast)
4 KiB <<< /dev/sda (block device 7.28 TiB): request=31 time=23.8 ms (fast)
4 KiB <<< /dev/sda (block device 7.28 TiB): request=32 time=68.3 ms
4 KiB <<< /dev/sda (block device 7.28 TiB): request=33 time=217.0 ms
4 KiB <<< /dev/sda (block device 7.28 TiB): request=34 time=68.9 ms
4 KiB <<< /dev/sda (block device 7.28 TiB): request=35 time=353.3 ms
Wow! Yes, you're reading that correctly. Sometimes a random read takes more than 1 second on that drive. So this drive obviously has an issue! In fact, I graphed the latency just to see how bad it is.
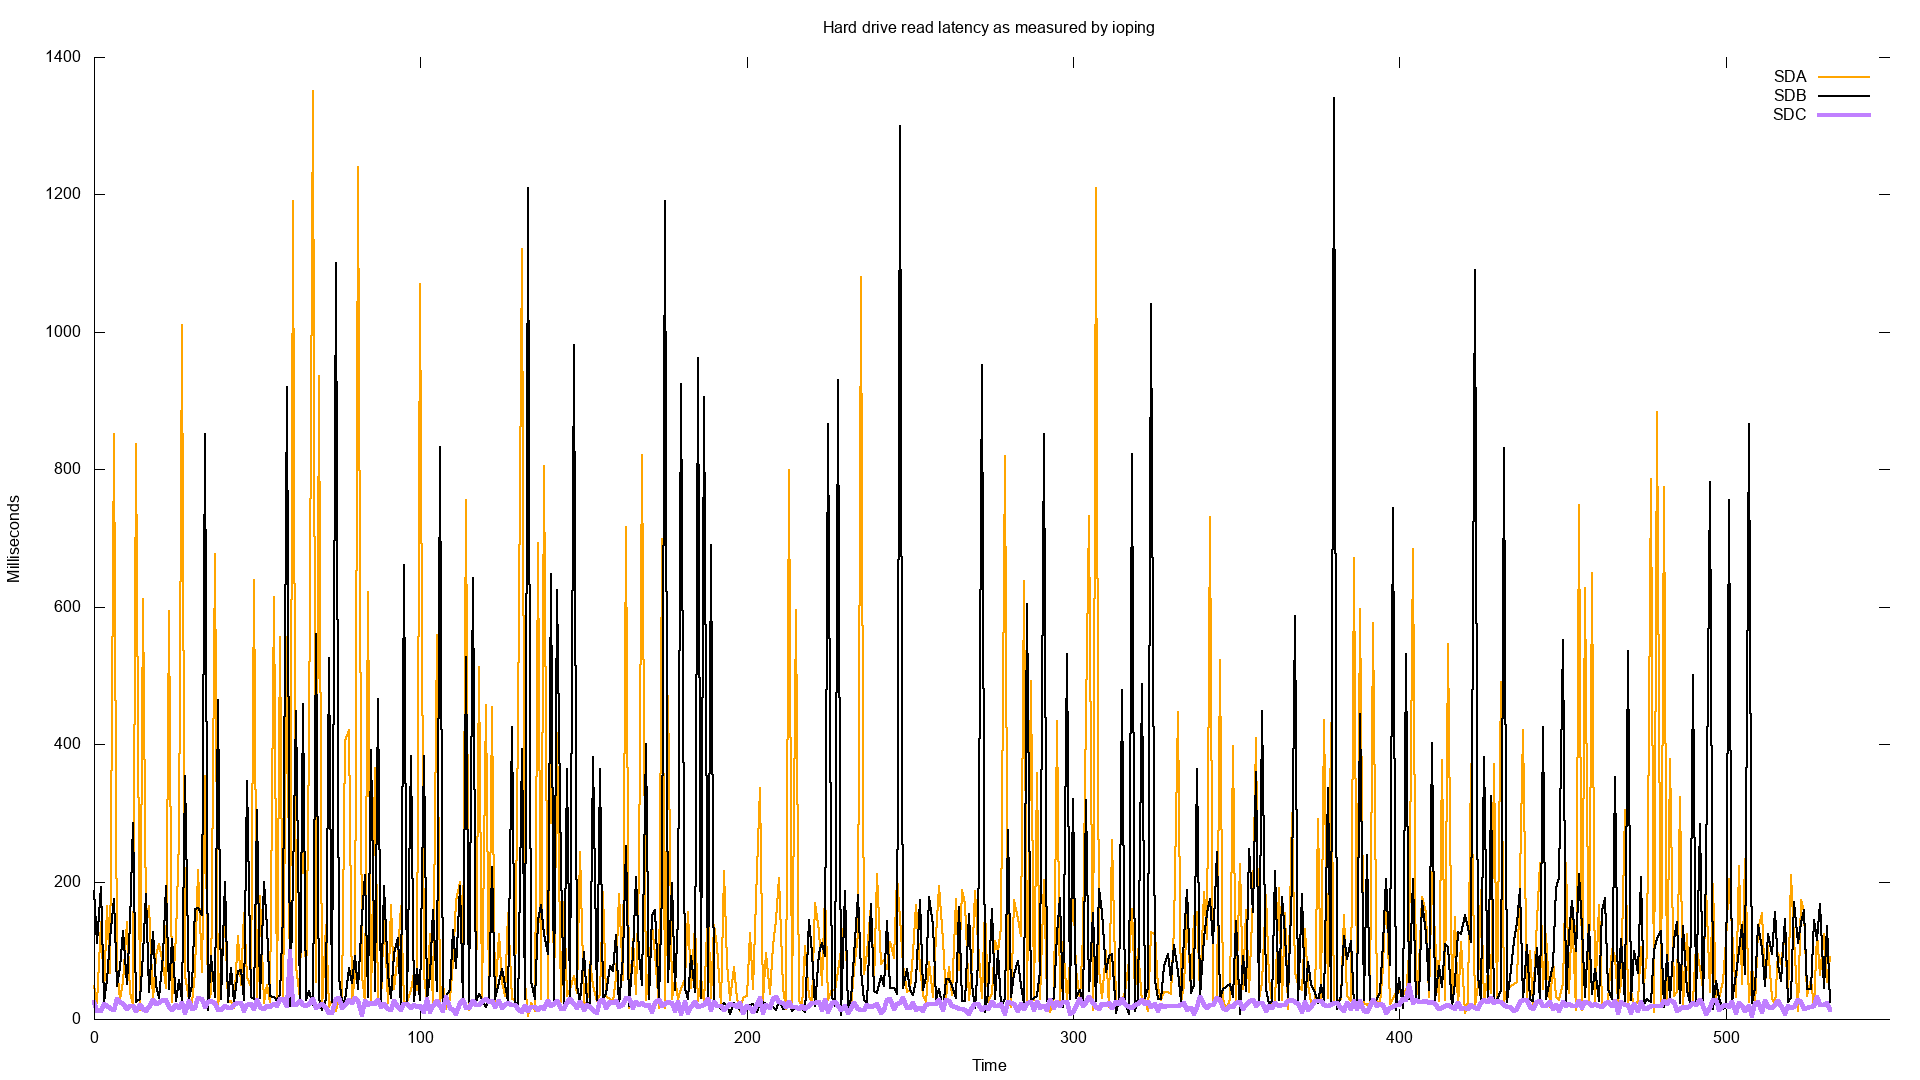
This plot shows the latency over time of the three of the hard drives
The plot aboves shows that the latency of /dev/sda and /dev/sdb is commonly 100x that of the other drive /dev/sdc. The purple line down at the very bottom is the latency of /dev/sdc, typically under 50 milliseconds. If just reading from the drive commonly takes more than 100 milliseconds, I could believe that the VM is suffering a huge performance impact when it has to write to one of the affected drives.
This is where things get really interesting. The problem basically just went away suddenly. The output of ioping for all drives went to a normal value of less than 20 milliseconds. I left it running for a while and it seemed OK. The "pauses" on the internet connection stopped. Given that I had changed nothing, I was not satisfied with this lack of any concrete explanation.
I googled the model number of one of the drives: ST8000DM004. At that point, I became very dismayed. The top result on Google is this post by Blocks & Files explaining that SMR has been sneaking into Seagate's consumer products. Back earlier in the year I had upgraded all of the mechanical drives in my host machine and was quite surprised just how cheap storage had become. Apparently that is a double edged sword. I had read all over the news that Western Digital had been doing this but I mistakenly assumed I was in the clear since I only use Seagate drives. Blocks & Files of course has a great write up about the Western Digital drives as well. There is even some discussion on the smartmontools issue tracker about this problem.
So I have SMR drives, how could this cause this problem? Conventional drives are apparently "CMR" drives. SMR stands for "shingled magnetic recording". I'm not going to go into a technical deep drive about how magnetic recording works. But apparently SMR has a huge data density advantage over CMR drives. SMR is only really good for workloads that write infrequently. Cherry picking some of Western Digital's comments about their SMR products:
... workloads tend to be bursty in nature, leaving sufficient idle time for garbage collection and other maintenance operations.
In other words, these drives cannot have sustained write-heavy workloads. I have a bunch of VMs and other tasks that are all writing to these drives so I guess I had just gotten lucky up to this point. This would explain why the problem disappeared on its own. The drive needed time to shuffle things around internally before performance could get back to normal.
In order to confirm this, I needed to cause the problem to happen again. The same physical drives are used to create another huge device with LVM that is then mounted as an ext4 filesystem in the host machine. Using some shell scripts I created tons of medium sized files all over the filesystem. The latency reported by ioping for the drives /dev/sda and /dev/sdb went up immediately. The "pause" came back. So I am confident this is a problem caused by the fact that these drives use SMR technology.
I wish I had known these drives were SMR before I purchased them. But I guess I am stuck with them for now. I probably have degraded these drives by using them to host the VM images. I also frequently have used them to record log files from different tests I have performed. My temporary fix for this was very simple: I migrated the virtual machines disks over to the SSD in the host machine. I plan to purchase some additional non-SMR drives to host the VM drive images.