Rendering matplotlib in PyQt 6
- Sunday June 04 2023
- python qt matplotlib
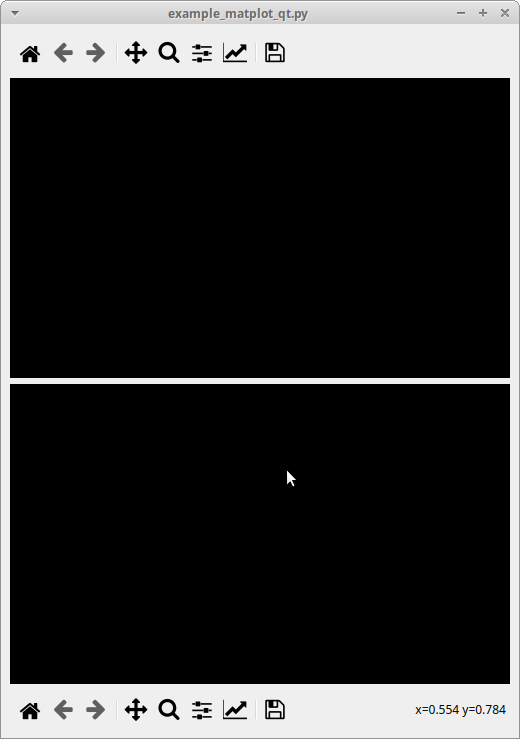
I have been using matplotlib on different projects now for a while. It is a great library to quickly generate graphs in almost any format. I recently got up to speed on PyQt6 for creating native user interfaces. I wanted to render a graph on my interface. There is no native component to facilitate graphing in Qt. I actually found an example of how to do this in matplotlib but I was not able to get that working. It runs, but all I see is this:
I spent a little bit of time looking at this, but realized it was overly complex for my use case in the first place. So I set out to come up with my own way of doing this. From my perspective, this task is best accomplished by getting matplotlib to render into an uncompressed image format and then getting PyQt6 to draw that into an area of the user interface.
Using matplotlib to render into a pixel buffer
Creating a plot in matplotlib is done by creating a Figure directly. The final result needs to be in a specific pixel geometry. This isn't directly supported, but you can configure the size of a figure in inches and the resolution by specifying the dots per inch. So what I did was define a function that handled this and renders some example data
def create_example_plot(width_px:int, height_px:int, xdata, ydata):
    dpi = 100 # use a fixed DPI
    width_inches = width_px / dpi
    height_inches = height_px / dpi

    fig = Figure(figsize=(width_inches, height_inches), dpi=dpi,layout='compressed')
    canvas = FigureCanvasAgg(fig)

    ax = fig.add_subplot()
    ax.set(ylim=(0.0, 110.0))
    ax.set_ylabel('Y Value')
    ax.set(xlim=(0.0, 1.0))
    ax.set_xlabel('X Value')
    ax.plot(xdata, ydata, color='green')

    canvas.draw()
    w, h = canvas.get_width_height(physical=True)
    print("rendering is %d X %d out of %d X %d" % (w, h, width_px, height_px,))

    # get a view into the raw data & make a deep copy
    rawdata = canvas.buffer_rgba()
    return w, h, bytearray(rawdata)
Matplotlib is normally used to render to a PNG file or similar format. In this case I need to get raw pixel data that can be drawn on the screen. My first attempt was calling canvas.tostring_rgb() to get a complete copy of the data in RGB format. This usually worked but I found that the program intermittently crashed with a segmentation fault. This is usually a good indicator of a memory access error. I changed the code to use a bytearray to make a deepcopy of the pixel data. This solved the crashing problem, but it wound up rendering something like this part of the time
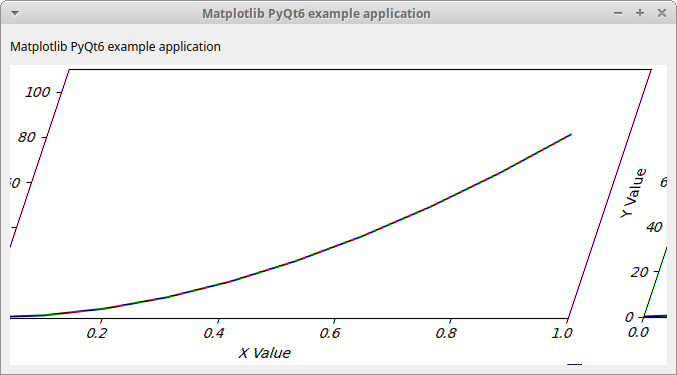
The reported geometry is different from the actual geometry.
The output appears tilted which is an indicator that the image width is not being handled correctly. After double checking my code I concluded that the rendering backend was not accurately reporting the number of pixels. I looked through the documentation and found out that calling canvas.buffer_rgba() gives a memory view to the underlying storage used by the canvas. So I made a deepcopy of that and got a working result. The outcome of this is a pixel buffer in RGB format with each color channel occupying one byte plus an extra byte for the alpha channel. So each pixel occupies four bytes in memory.
There is the possiblity that the conversion from pixels to inches involves a rounding error, so the returned value includes whatever pixel geometry matplotlib decides upon. That can be used by the rendering code to draw the pixel data.
Getting PyQt6 to draw a pixel buffer
After looking around in the Qt documentation it turns out you can use pretty much anything as a target for drawing. There is a QPainter type that allows you to draw on anything that is a QWidget. So what I did was define my own class to act like a generic canvas element that knows when to render using matplotlib. In that method we need to do the following
- Create a
QPainterobject that is targeting this widget - Fill the buffer with a background color, black in my example
- Check for plot data, if there is run the plot function using the current dimensions of the widget
- Paint the image onto the widget, showing the user the graph
I applied an additional optimization that if paintEvent() is called and the widgets screen dimensions have not changed then the plot function is not called again, the image is just painted on to the widget a second time.
class PlotRenderArea(QWidget):
    def __init__(self, width: int, height: int, plot_fn):
        super().__init__()
        self.l = QMutex() # used to protect access to self.plot_data
        self.image = None
        self.last_dim = None
        self.setMinimumSize(width, height)
        self.plot_fn = plot_fn
        self.plot_data = None

    def set_plot_data(self, **kwargs):
        with QMutexLocker(self.l):
            self.plot_data = kwargs # store the data
            self.last_dim = None # clear the most recent render
            self.image = None
        self.update() # signal Qt to redraw this now

    def paintEvent(self, paintEvent) -> None:
        # this is called whenever Qt is redrawing this UI element
        sz = self.size()
        with QMutexLocker(self.l):
            needs_render = True
            if self.last_dim is not None:
                last_width, last_height = self.last_dim
                if sz.width() == last_width and sz.height() == last_height:
                    needs_render = False


            painter = QPainter(self)
            # fill with black
            painter.fillRect(QRect(0, 0, sz.width(), sz.height()), QColor(0, 0, 0))
            # if there is data and it needs to be rendered, do it
            if self.plot_data is not None and needs_render:
                w, h, rgb_data = self.plot_fn(sz.width(), sz.height(), **self.plot_data)
                self.image = QImage(rgb_data, w, h, QImage.Format.Format_RGBA8888)

            # paint the image if it exists
            if self.image is not None:
                draw_w = min(sz.width(), self.image.width())
                draw_h = min(sz.height(), self.image.height())
                print("rendering %d X %d" % (draw_w, draw_h))


                painter.drawImage(0, 0, self.image, 0, 0, draw_w, draw_h)
            # store the dimensions
            self.last_dim = (sz.width(), sz.height(),)
What this does is creates a widget with a stored image buffer. The widget overrides the paintEvent method to paint the image in place of the normal widget apparance. The image is created by calling a function to plot the data. The function is called with the following arguments
- width of the widget in pixels
- height of the widget in pixels
- any keyword arguments passed to
set_plot_data
The keyword arguments can be updated at any time by calling set_plot_data() to change the displayed plot. Calling that function also makes a call to update() which indicates to Qt that a repaint needs to happen.
Since the type inherits from is the generic QWidget there is no information available to the Qt framework to figure out how many pixels the widget takes up. To remedy this in the constructor setMinimumSize is called to guarantee a minimum amount of screen space.
Accces to the variable self.image is protected by a QMutex since it is shared data. When the QImage instance is constructed the format is specified as QImage.Format.Format_RGAB8888 since that is the format that matplotlib creates output in.
Putting it together
When these two aspects are combined we wind up with a simple program to demo this working. The window can be resized to basically any size and still is able to display the plot. It looks like this
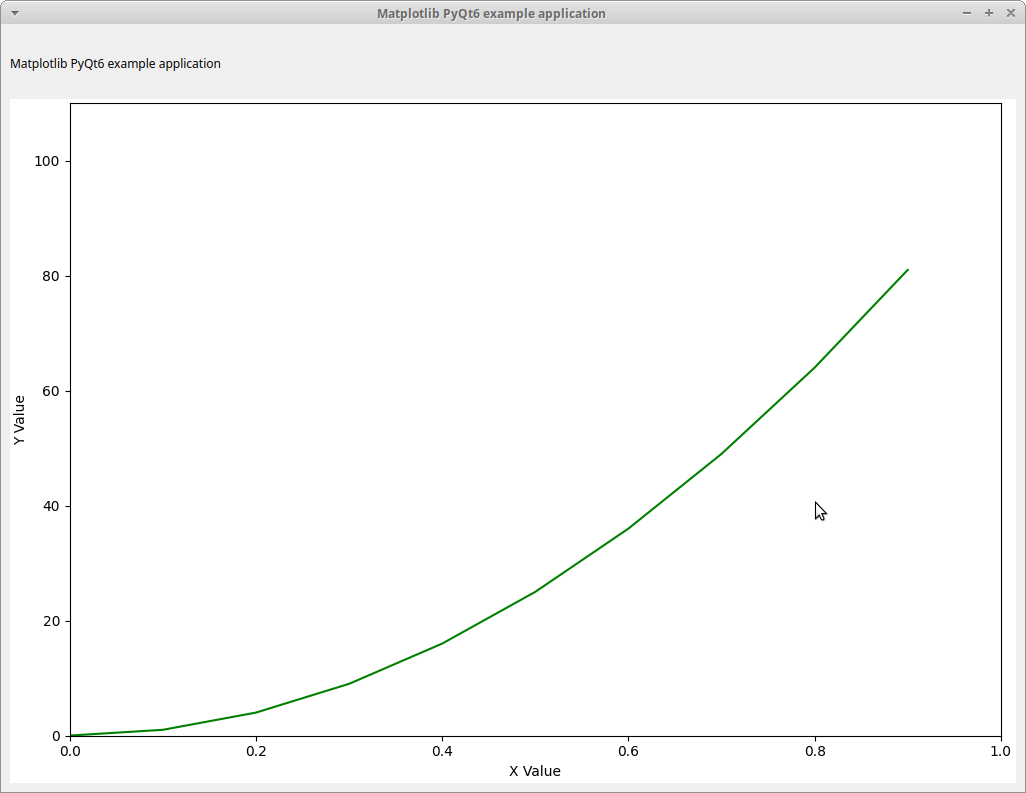
Normal size window
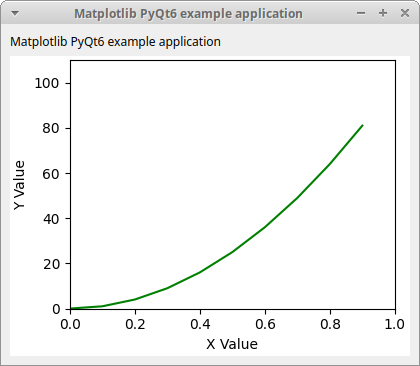
A small window showing the same data
The window can be resized to basically any size and still is able to display the plot.
Source code
The entire example is available as a single file to download