Making and measuring a crystal filter
One of the key components of almost any single sideband transmitter is a crystal filter. This is used to isolate the desired sideband after mixing the first intermediate frequency and the audio frequency togehter. This filter needs to be very narrow, so crystals are used. The schematic for the simplest filter you can build of this type looks like this
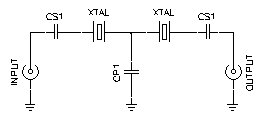
This was retrieved from this excellent calculator. This calculator can be used to design the desired filter based off the crystals you have at hand. I don't know much about different crystal resonance modes and how to measure them. In my case, I also just need a narrow filter on any frequency. I'm usually more interested in trying to build things and seeing what happens rather than doing lots of theory. So I decided to just build a simple crystal filter and see how it performed.
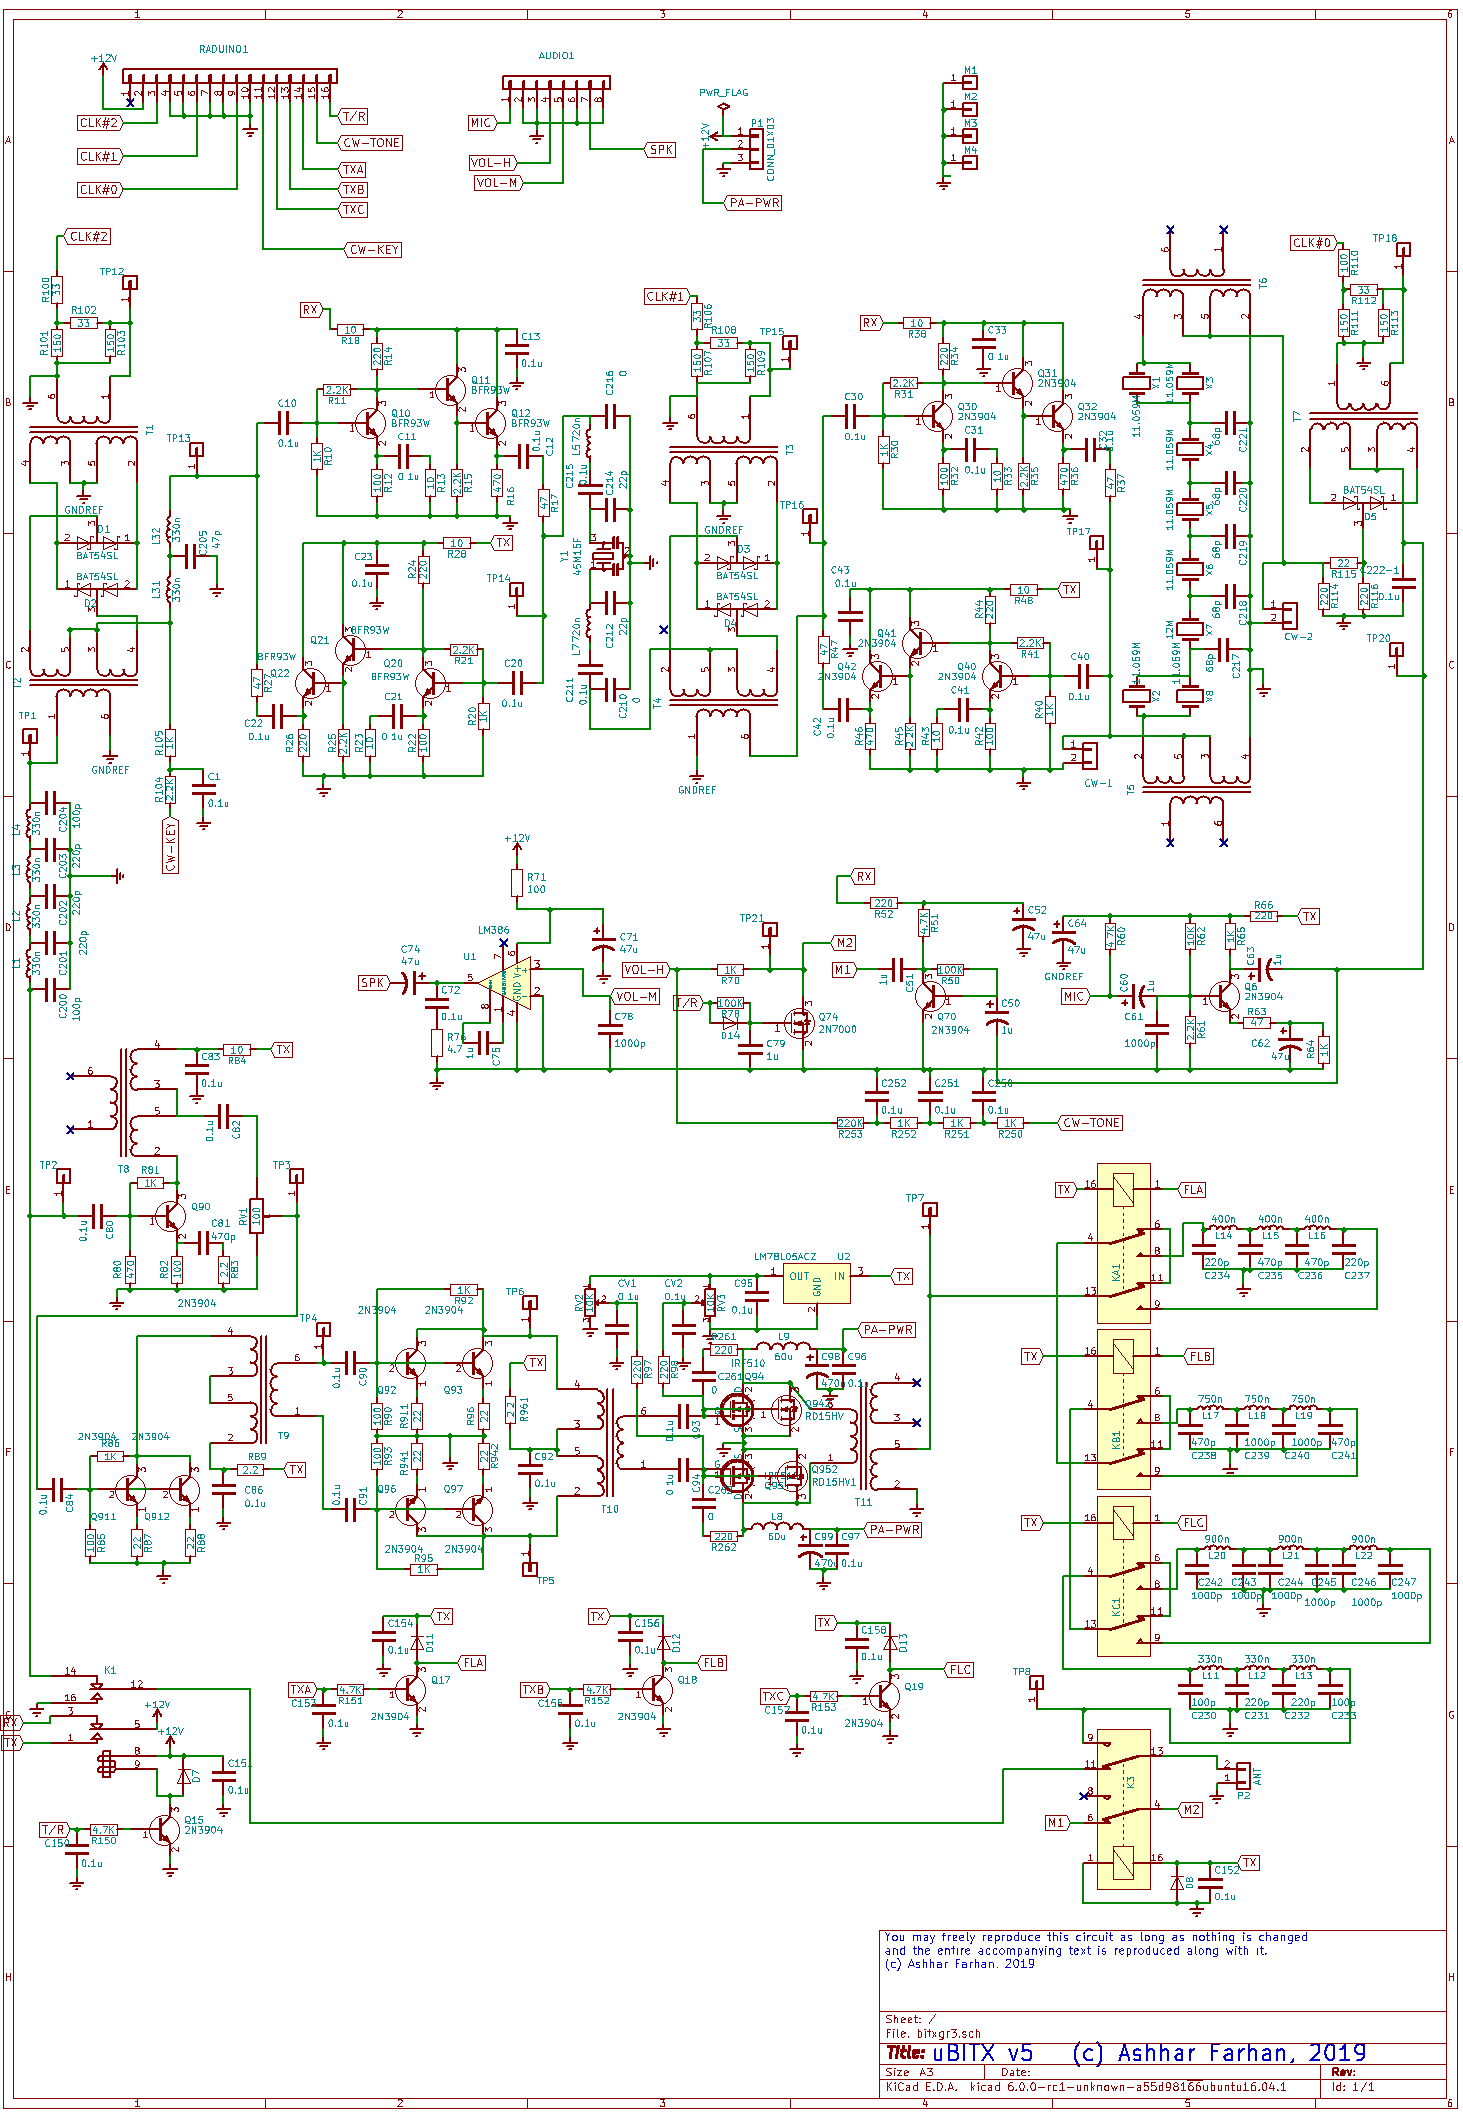
To select the crystals, I decided to copy someone elses work. The ubitx is a HF transceiver that uses a six-pole crystal filter made of 11.059 MHz crystals and 68 picofarad capacitors. You can view the full schematic here
This is a six pole filter, but I used the same values to build a two pole version
This was assembled using a piece of copper clad PCB board that had a section etched out for the junctions of the filter.
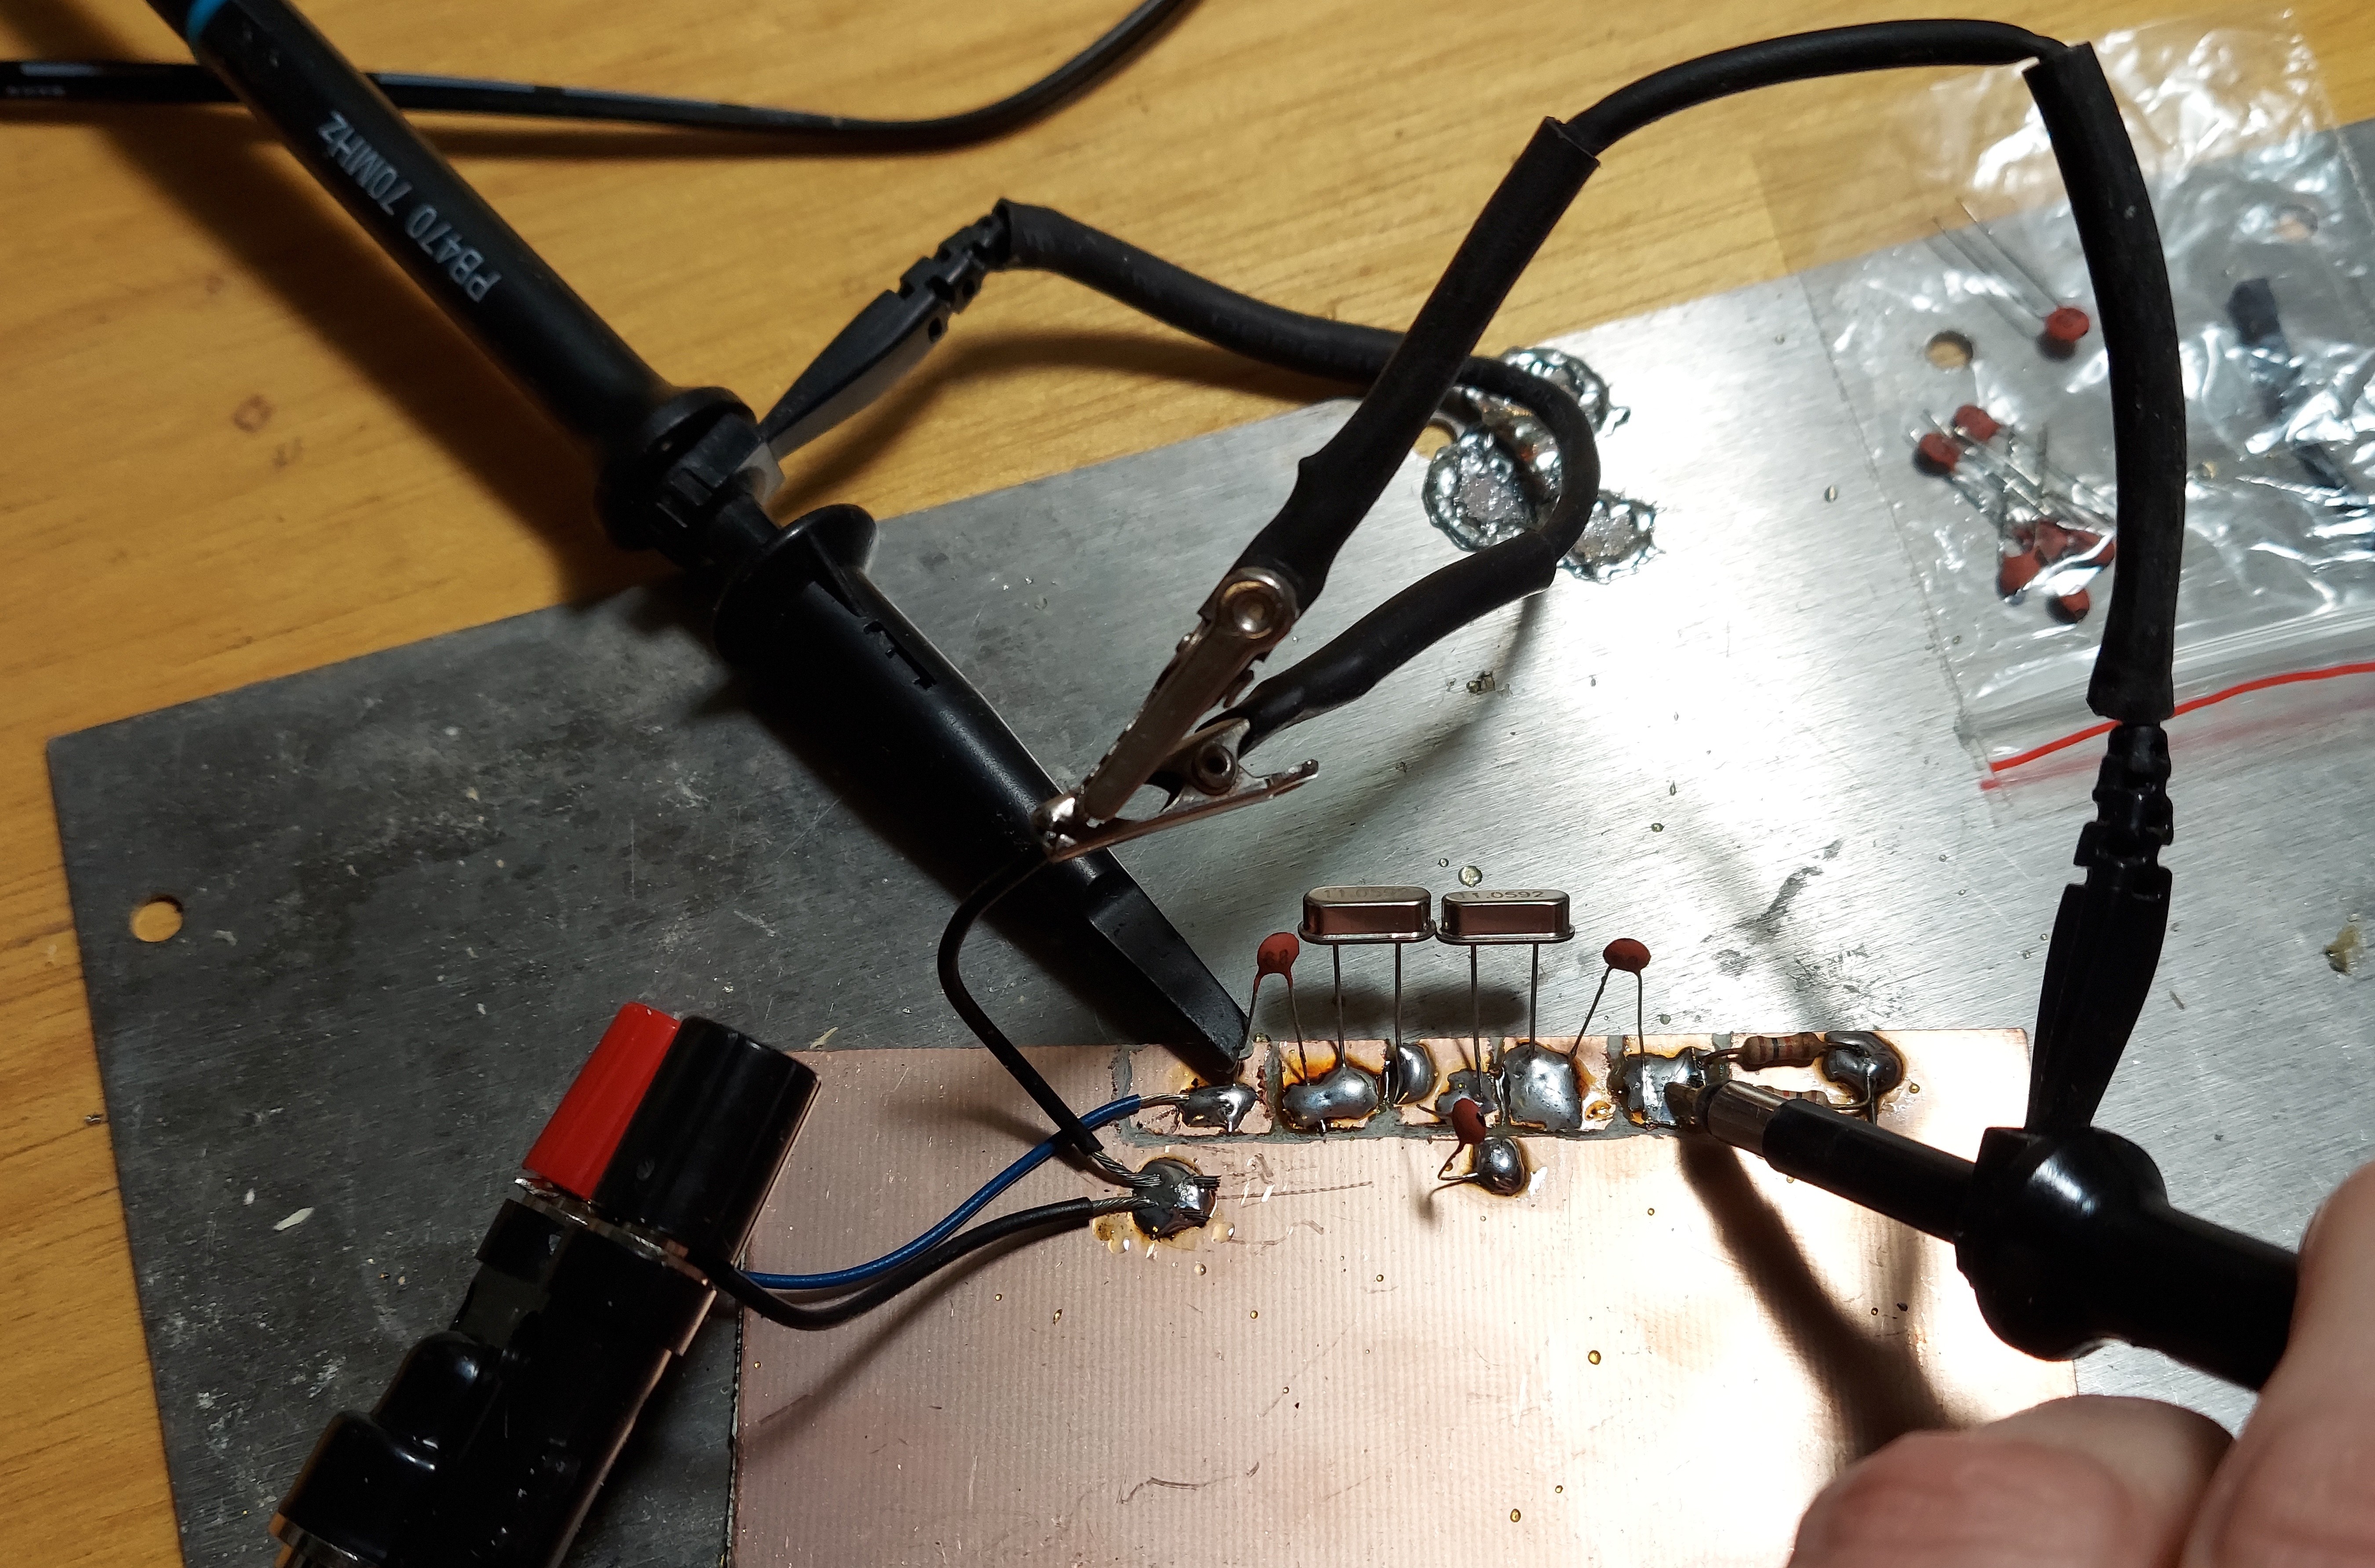
The input is on the left and is connected to my signal generator. The output is terminated into 3 parallel 1000 ohm resistors for an impedance of 329.4 ohms. The probes are connected to my oscilloscope. I had to hold one of the probes in place since I lost the part allows me to clip the probe to the part being tested.
Using the signal generator I can generate RF in the range of 11.059 MHz, which is the crystals design frequency. At some nearby frequency this filter should allow almost all of the signal to pass through. When the frequency is above or below that frequency the filter should attenuate out the signal.
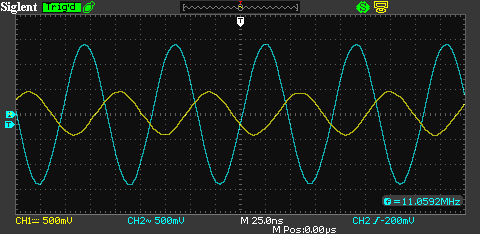
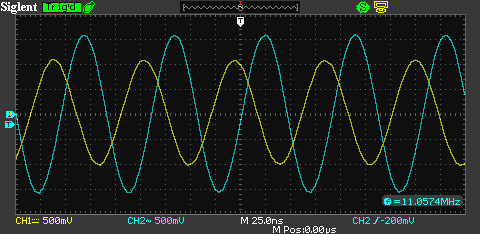
This is what it looks on the oscilloscope. The blue trace is channel 2, showing the output of the signal generator. The yellow trace is channel 1 showing the output of the filter measured at the termination resistor.
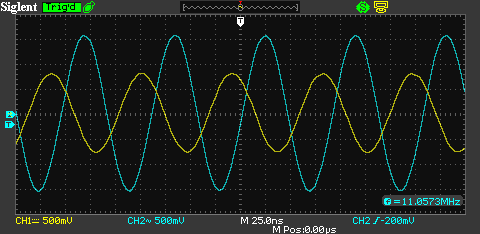


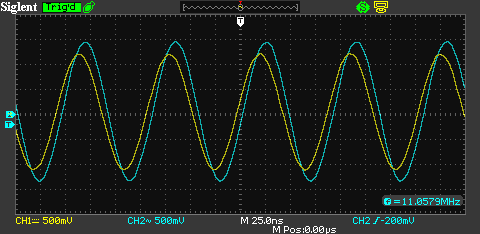

Of particular confusion is the final oscilloscope trace, which seemingly indicates the filter has more signal coming out of it than going in. I can only guess this is due to resonance caused by the inductance and capacitance of the circuit arrangement.
Computing the passband of the filter
While oscilloscope traces are neat to look at, they don't really show a useful picture. I need to determine what frequencies pass through the filter and which ones are attenuated out.
I used the oscilloscope to capture data into CSV files. I used a python script to process each one. Each datapoint recorded is voltage and time.
I computed the attenuation by doing the following
- For each channel, compute the sum of squares of all the datapoints.
- Divide each sum by the total number of samples
- Compute the square root of each of these values. This gives the RMS voltage of each channel.
- Using the RMS voltage of channel 1, compute the power delivered into the termination.
- Using the RMS voltage of channel 2, compute the power that would be delivered if the filter was not present
- Compute the difference in decibels
Power in step 4 and 5 is computed as
Where \(V\) is the RMS voltage and \(R\) is the impedance of the termination. This is a rearrangement of Ohm's law.
Decibels is computed as
Where \(P_f\) is the power delivered into the termination with the filter and \(P\) is the power that would be delivered without the termination. The value \(d\) is the attenuation of the filter at the frequency being used at that datapoint. This had to be repeated for a bunch of different frequencies in order to graph something useful.
Graphing the results
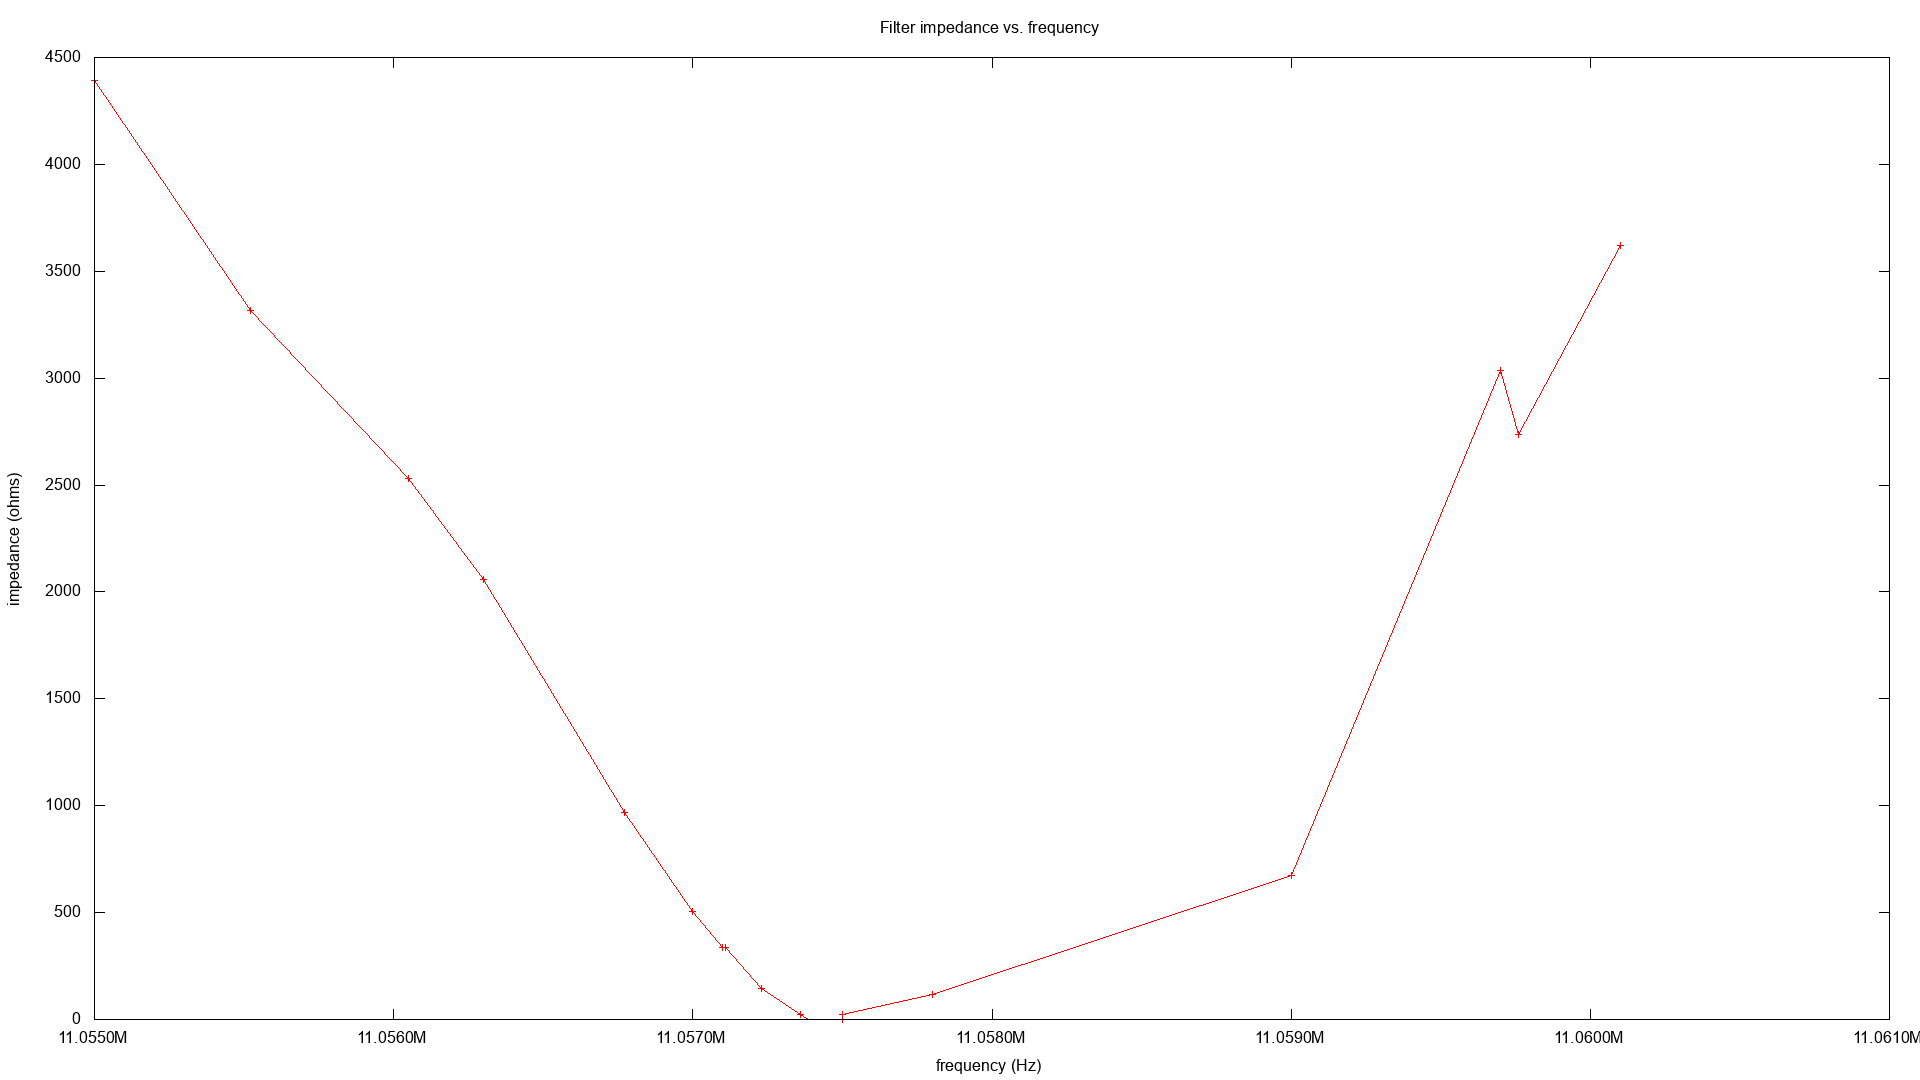
I ended up graphing the results in two ways. The first is the difference in decibels. The second is the apparent impedance of the filter.
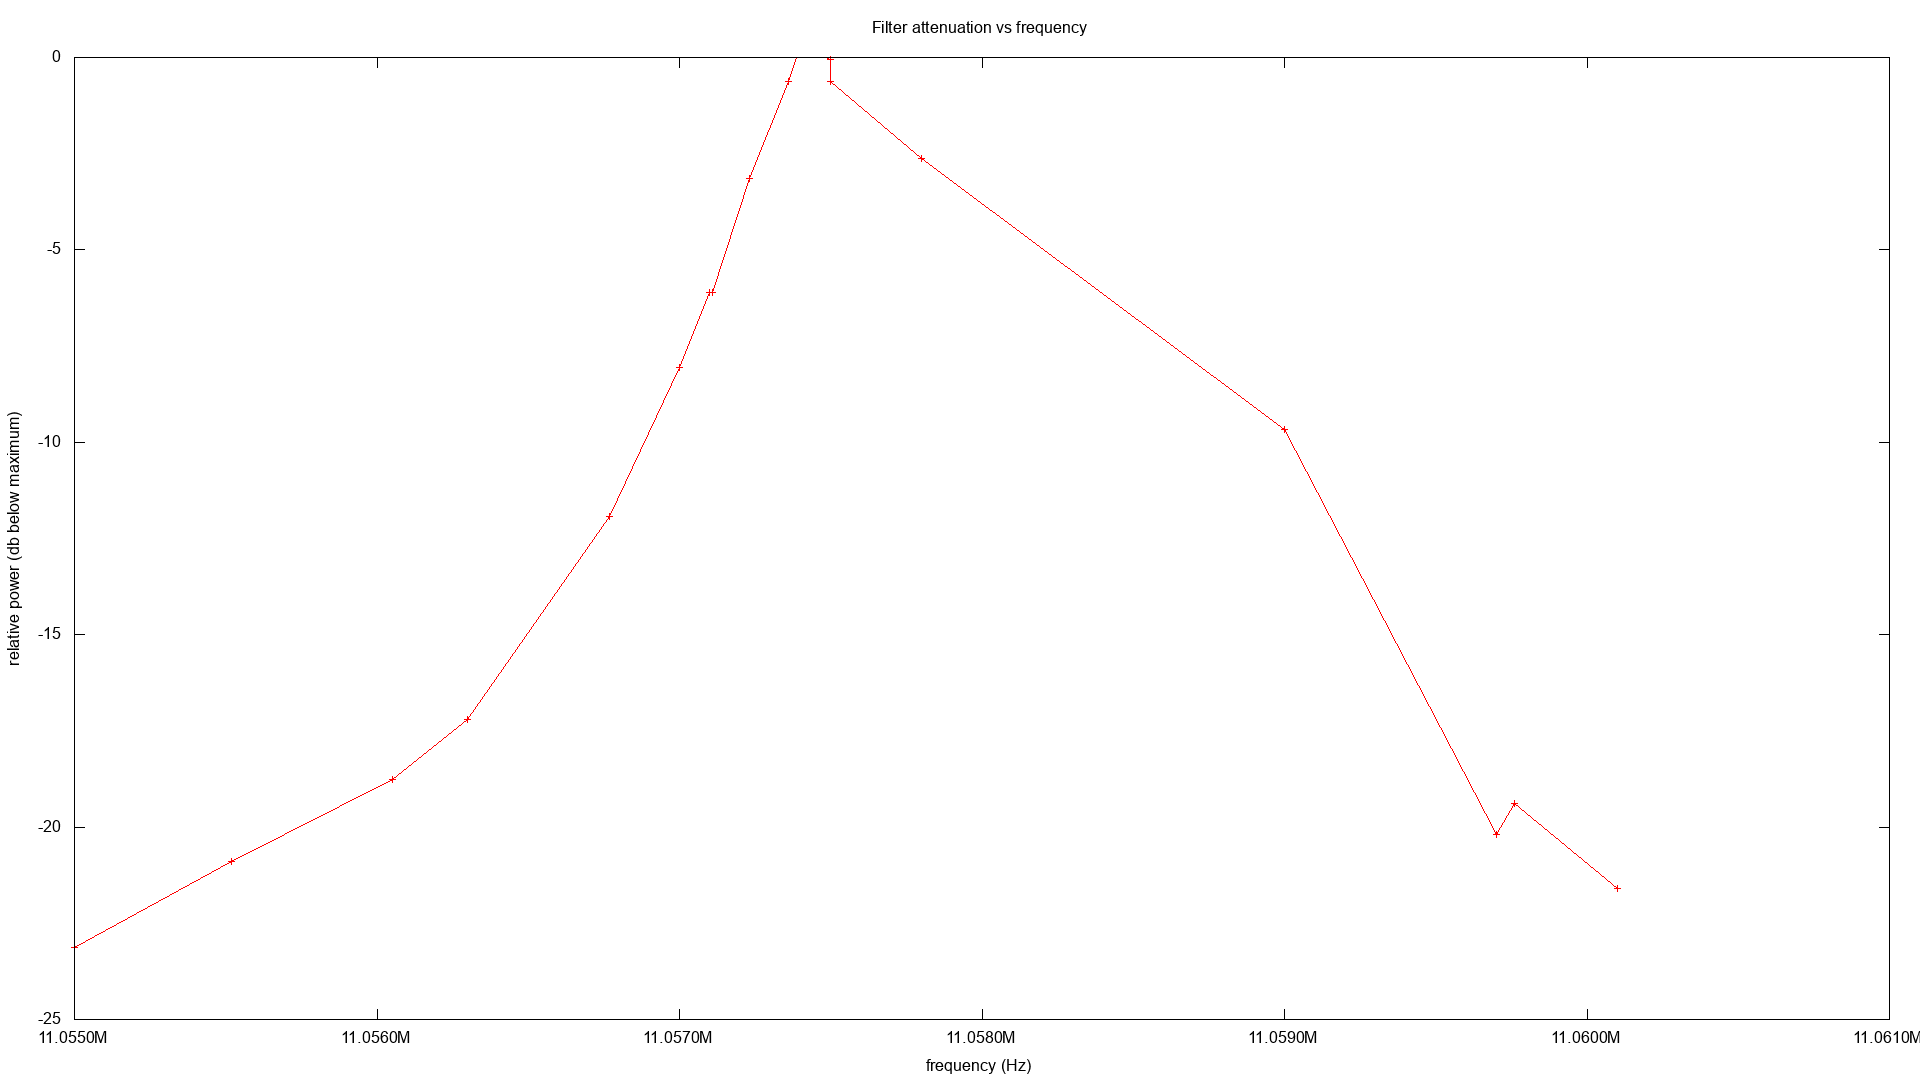
There is a weird "knee" near 11.060 MHz but I suppose I may have just transposed the frequencies used in my notes. This filter appears to be very narrow for such a simple design. A signal on 11.0575 MHz would pass through with little to no attenuation. A signal that is 3 kHz lower on 11.0545 MHz would have an attenuation of greater than 22 db.
Code and data
You can get the data and code I used for this project here. You also need a python module for parsing the CSV files from the oscilloscope that I wrote. You can download it from GitHub.